Employee numbers up by 774 in 2015
At the end of 2015, the HUGO BOSS Group had 13,764 employees around the world (2014: 12,990). This was an increase of 774 or 6% on the previous year and reflects last year’s general business performance and the Group’s growing focus on its own retail business.
Number of employees as of December 31

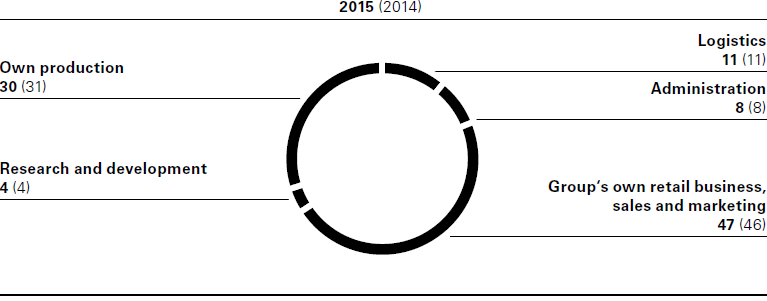
The number of employees in the Group’s own retail business rose to 5,349 (2014: 4,965). Most of the new hires in this segment were in Europe. At the same time, the Group increased capacity for its omnichannel activities, particularly in digital marketing. With the expansion of its omnichannel activities, the Group is responding to customers’ growing expectations of a consistent and seamless shopping experience embracing brick-and-mortar stores and digital retailing. Group Strategy
Employees by functional area as of December 31 (in %)

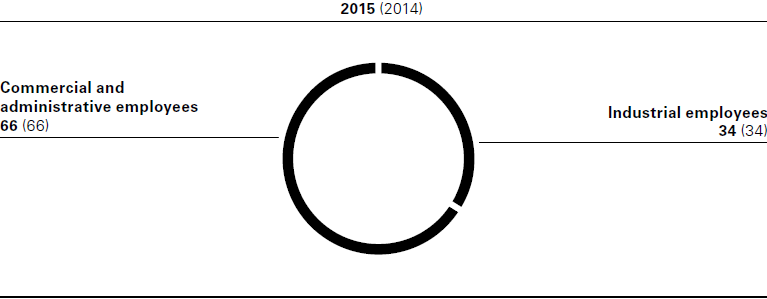
The ratio between employees in commercial positions and employees in industrial functions remained unchanged year on year. At the end of 2015, 9,150 employees (2014: 8,562) or 66% of the total workforce were in commercial jobs, while 4,614 employees (2014: 4,228) or 34% of the total workforce were assigned to industrial activities. Notes to the Consolidated Financial Statements, Note 10
Industrial, commercial and administrative employees as of December 31 (in %)

Corporate culture shaped by international outlook, openness and diversity
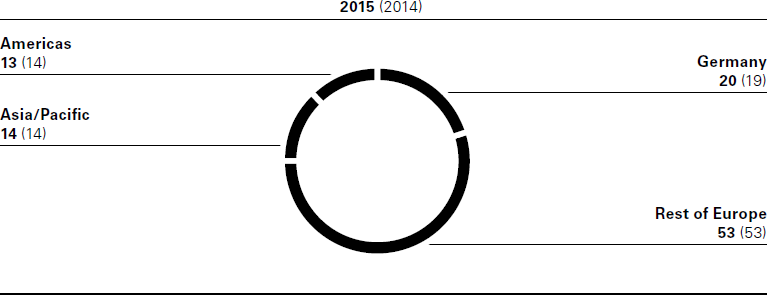
HUGO BOSS’ corporate culture is shaped by the international outlook, openness and diversity of its employees. This is reflected in the regional distribution of the workforce. 80% of the Group’s employees were based outside Germany last year (2014: 81%).
Employees by region as of December 31 (in %)

Continued high share of women in management
At 59%, women account for the majority of the HUGO BOSS Group’s workforce (2014: 60%). Women held 45% of the positions across all four management levels at the end of December 2015 (2014: 45%). The Managing Board set a target of at least 30% of women in each of the two management levels below the Managing Board to be achieved by June 30, 2017. At the end of 2015, 28% (2014: 27%) of the positions in the first management level below the Managing Board and 45% (2014: 43%) of the positions in the second management level below the Managing Board were held by women. Corporate Governance Report
|
2015 |
2014 |
||
Proportion of men in total workforce |
41 |
40 |
||
Proportion of women in total workforce |
59 |
60 |
||
Proportion of men in management |
55 |
55 |
||
Thereof first management level |
72 |
73 |
||
Thereof second management level |
55 |
57 |
||
Proportion of women in management |
45 |
45 |
||
Thereof first management level |
28 |
27 |
||
Thereof second management level |
45 |
43 |
||
Average age in years |
35 |
35 |