Asia/Pacific
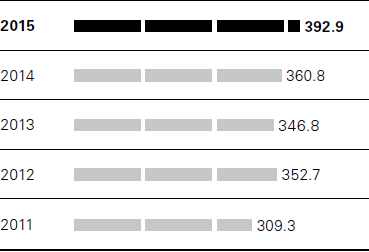
Sales Asia/Pacific (in EUR million)

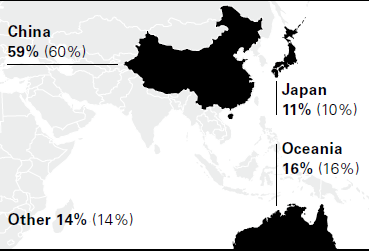
Share in sales Asia/Pacific 2015 (2014)

In fiscal year 2015, sales in Asia/Pacific were EUR 393 million in the reporting currency, 9% higher than a year before (2014: EUR 361 million). The deterioration in market conditions in China, which burdened the performance of HUGO BOSS in this market, caused sales to decrease by 3% in local currencies.
Takeovers in South Korea and China support sales in the Group’s own retail business
Sales in the Group’s own retail business in this region rose by 16% to EUR 341 million in the reporting currency (2014: EUR 295 million). This is equivalent to growth of 3% in local currencies compared to the prior year. By contrast, at EUR 52 million, sales with wholesale customers were down 22% from the prior year in the Group’s reporting currency (2014: EUR 66 million). This translates into a 31% decline in local currencies. Takeovers of selling space previously operated by wholesale partners in South Korea and China led to a shift in sales from wholesale to the the Group’s own retail business.
Currency-adjusted sales growth in Oceania and Japan
At EUR 232 million, sales in China were up 8% on the prior year (2014: EUR 215 million). Against the backdrop of deteriorating market conditions, currency-adjusted sales decreased by 9%. At EUR 61 million, sales in Oceania increased by 7% on the prior year (2014: EUR 57 million). Supported by significant productivity gains in the Group’s own retail business, sales increased by 8% adjusted for currency effects. At EUR 43 million, sales in Japan rose to 12% above the previous year’s level (2014: EUR 38 million). This is equivalent to a sales increase of 7% adjusted for currency effects.
Profit development Asia/Pacific

Segment profit dragged down by sales development in China
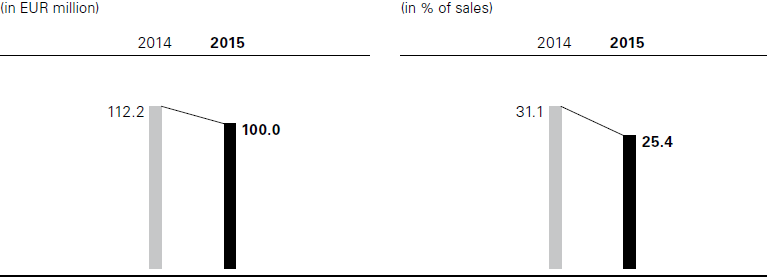
At EUR 100 million, segment profit in Asia/Pacific was down 11% on the prior-year level (2014: EUR 112 million). Sales in China and a disproportionately large increase in selling and distribution expenses, particularly in connection with the expansion of the Group’s own retail business, negated the positive exchange rate effects in this region. At 25.4%, the adjusted EBITDA margin in this region was down 570 basis points from the prior year (2014: 31.1%).