Earnings development
Sales development
Sales of HUGO BOSS AG up 8%
In fiscal year 2015, sales of HUGO BOSS AG increased 8% to EUR 1,250 million (2014: EUR 1,155 million). This performance was aided by higher sales both in the Group’s own retail business and with wholesale partners in Germany and Austria. The expanded retail activities of its subsidiaries also made a valuable contribution to this rise.
Regional sales performance (in %)
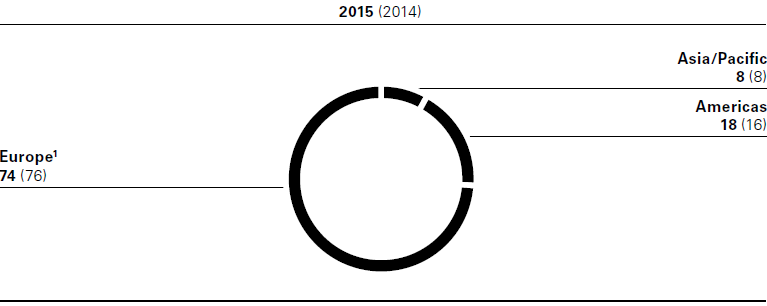
1 Including Middle East and Africa.
In Europe (including the Middle East and Africa), sales with subsidiaries of HUGO BOSS AG increased 10% in fiscal year 2015 to EUR 436 million (2014: EUR 397 million). Sales with third parties increased 3% to EUR 488 million in the same period (2014: EUR 474 million). Sales outside Germany and Austria were mainly generated with subsidiaries.
Sales of HUGO BOSS AG with subsidiaries in the Americas increased 16% to EUR 220 million (2014: EUR 189 million). In the Asia/Pacific region HUGO BOSS AG experienced an increase in sales of 12% to EUR 106 million (2014: EUR 95 million).
Sales of the BOSS brand, including the brand lines BOSS Orange and BOSS Green, rose 7% to EUR 1,091 million (2014: EUR 1,019 million). The HUGO brand in fiscal year 2015 saw a sales increase of 17% to EUR 159 million (2014: EUR 136 million).
Development of earnings
|
2015 |
In % of sales |
2014 |
In % of sales |
Change in % |
|||||
Sales |
1,250.0 |
100.0 |
1,155.0 |
100.0 |
8 |
|||||
Cost of sales |
(729.7) |
(58.4) |
(696.0) |
(60.3) |
(5) |
|||||
Gross profit |
520.3 |
41.6 |
459.0 |
39.7 |
13 |
|||||
Distribution Costs |
(369.1) |
(29.5) |
(327.0) |
(28.3) |
(13) |
|||||
General administrative expenses |
(102.7) |
(8.2) |
(95.4) |
(8.3) |
(8) |
|||||
Other operating income |
171.6 |
13.7 |
155.9 |
13.5 |
10 |
|||||
Other operating expenses |
(69.8) |
(5.6) |
(66.2) |
(5.7) |
(6) |
|||||
Operating profit |
150.3 |
12.0 |
126.3 |
10.9 |
19 |
|||||
Income from investments in affiliated companies |
229.8 |
18.4 |
228.3 |
19.8 |
1 |
|||||
Net interest income/expenses |
(12.4) |
(1.0) |
(7.2) |
(0.6) |
(72) |
|||||
Income from ordinary activities |
367.7 |
29.4 |
347.4 |
30.1 |
6 |
|||||
Taxes on income and other taxes |
(64.0) |
(5.1) |
(55.7) |
(4.8) |
(15) |
|||||
Net income |
303.8 |
24.3 |
291.7 |
25.3 |
4 |
|||||
Transfer to (-)/ |
(54.0) |
(4.3) |
(41.5) |
(3.6) |
>(100) |
|||||
Accumulated income previous year |
5.0 |
0.4 |
4.6 |
0.4 |
9 |
|||||
Unappropriated income |
254.8 |
20.4 |
254.8 |
22.1 |
0 |
Gross profit margin increases 190 basis points
At EUR 520 million, gross profit was up 13% on the prior-year level (2014: EUR 459 million). The gross profit margin hence increased from 39.7% in the prior year to 41.6%. This development was aided alongside currency effects by the increased share of sales accounted for by the own retail business and efficiency gains in production and sourcing activities.
Distribution costs rose 13% in the past fiscal year to EUR 369 million (2014: EUR 327 million). Increased sales in the own retail business led in particular to increased expenses in connection with rental agreements linked to sales performance. Furthermore, intensified brand communication activities resulted in an increase in marketing expenses in comparison to the previous year. Finally, additional lease expenses associated with the commissioning of the new flat-packed goods distribution center in the third quarter of 2014 contributed to an increase in logistics expenses.
General administrative expenses increased 8% to EUR 103 million (2014: EUR 95 million) and mainly comprised personnel expenses, rent for premises, lease expenses, amortization and depreciation as well as various IT costs. The increase mainly stems from higher personnel expenses and the greater amortization charged on enterprise software.
Other operating expenses mainly comprise research and development costs, bad debt allowances and exchange rate effects and increased 6% year-on-year to EUR 70 million (2014: EUR 66 million).
In the past fiscal year, other operating income amounted to EUR 172 million (2014: EUR 156 million) and mainly breaks down into cost allocations and services rendered to affiliated companies.
Operating profit considerably up on prior year
Operating profit rose 19% in particular thanks to the positive development of gross profit to EUR 150 million in comparison to the previous year (2014: EUR 126 million).
At EUR 230 million, income from investments in affiliated companies was up 1% year-on-year (2014: EUR 228 million). Income from investments in affiliated companies of EUR 90 million (2014: EUR 89 million) mainly concerns the net income of HUGO BOSS Trade Mark Management GmbH & Co. KG, which is transferred to and drawn from the loan account of HUGO BOSS AG as limited partner in accordance with the partnership agreement. Income from profit and loss transfer agreements pertains to income from profit and loss transfer agreements in place with subsidiaries of HUGO BOSS AG. In fiscal year 2015, as in the prior year, this amounted to EUR 140 million (2014: EUR 140 million) and resulted from the transfer of profit from HUGO BOSS Internationale Beteiligungs-GmbH, Metzingen. In fiscal year 2015, this company received dividend income from HUGO BOSS Holding Netherlands B.V.. In the past fiscal year, as in the year before, expenses from loss absorption were immaterial.
The interest result as a net expense (other interest and similar income less interest and similar expenses) increased in fiscal year 2015 to EUR 12 million (2014: EUR 7 million). This change was fueled in particular by a year-on-year increase in borrowing and higher interest expenses resulting from the accrued interest on long-term personnel provisions. It was also due to interest expenses in connection with the tax field audit for the years 2007 to 2011.
Income before taxes amounted to EUR 368 million in fiscal year 2015, up 6% on the prior year (2014: EUR 347 million). This rise is attributable primarily to the higher operating profit.
At 17%, the effective tax rate was slightly above the prior-year level (2014: 16%), resulting mainly from the increased municipal trade tax multiplier at the Group’s Metzingen headquarters and the significantly higher operating profit versus the tax-privileged income from investments. Expenses from income taxes relating to other periods remained unchanged at EUR 2 million (2014: EUR 2 million). As in the previous year, the income taxes relating to other periods mainly stem from the recognition of a provision for risks in connection with the tax field audit for the years 2007 – 2011 including subsequent effects.
Net income up 4%
At EUR 304 million, the net income for fiscal year 2015 was thus up 4% on the prior-year level (2014: EUR 292 million).