Notes to the Income Statement
Gross profit margin (in %)
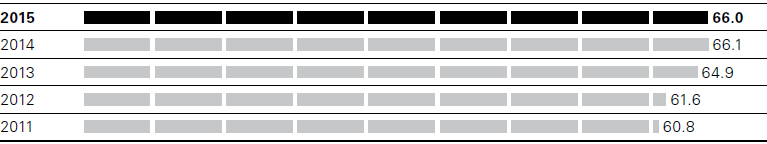
Gross profit margin slightly below last year’s at 66.0%
The gross profit in fiscal year 2015, at EUR 1,853 million, was 9% above the prior-year figure (2014: EUR 1,699 million). At 66.0%, the gross profit margin was slightly lower than in the prior year (2014: 66.1%). Positive effects stemming from above-average growth in the Group’s own retail business, in which HUGO BOSS generates a higher gross profit margin than in the wholesale channel, were offset by increased discounting.
Expansion of the Group’s own retail business results in higher selling expenses
Selling and marketing expenses in fiscal year 2015 totaled EUR 1,137 million, up 14% year on year (2014: EUR 995 million). Currency effects made a material contribution to this increase. Relative to sales, selling and marketing expenses increased from 38.7% to 40.5%. Particularly due to the global expansion of the Group’s own retail business, selling expenses in the reporting year increased by 14% compared to the prior year, accounting for 31.1% of sales (2014: 29.7%). This includes additional expenses for the net increase of 42 freestanding retail stores which were opened or taken over in the course of the global expansion of this sales channel in fiscal year 2015. The year-on-year increase in selling and marketing expenses of 17% mainly reflects intensified brand communication activities in the areas of advertising, digital and retail marketing. In relation to sales, selling and marketing expenses increased compared to the prior year to 6.8% (2014: 6.3%). Additional lease expenses associated with the commissioning of the new flat-packed goods distribution center in Germany in the third quarter of 2014 contributed to an 8% increase in logistics expenses compared with the prior year. At 2.6%, they accounted for the same percentage of sales as in the prior year (2014: 2.6%). Bad debt allowances and bad debts were again of secondary importance in the fiscal year 2015 on account of continued strict receivables management and the declining proportion of the wholesale business in consolidated sales. Notes to the Consolidated Financial Statements, Note 3
Slight increase in administration expenses in relation to sales
Administration expenses in fiscal year 2015 totaled EUR 264 million, up 12% year on year (2014: EUR 236 million). Currency effects made a material contribution to this increase. As a percentage of sales the administration expenses increased slightly, amounting to 9.4% (2014: 9.2%). General administration expenses increased by 14% and, at 7.1% of sales, were up on the prior-year period (2014: 6.8%). Research and development costs incurred during the creation of fashion collections rose by 6% compared to the prior-year period and accounted for 2.3% of sales, slightly less than in the prior year (2014: 2.4%). Notes to the Consolidated Financial Statements, Note 4
The net expense arising from other operating expenses and income was EUR 4 million (2014: net expense of EUR 19 million). This includes special items which mainly relate to the early dissolution of contracts with trade agents and service providers as well as organizational changes in Europe and the Americas. In the second quarter of 2015, the sale of the production site in Cleveland, Ohio, led to the release of provisions recognized in 2014. The resultant income partially offset the expenses arising from special items. Notes to the Consolidated Financial Statements, Note 5
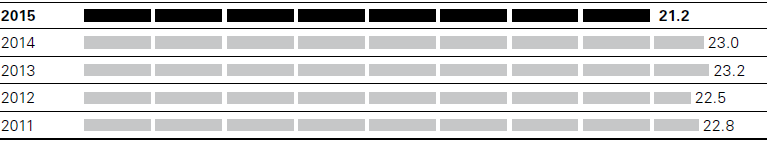
Adjusted EBITDA margin (in %)
EBITDA before special items by quarter (in EUR million)
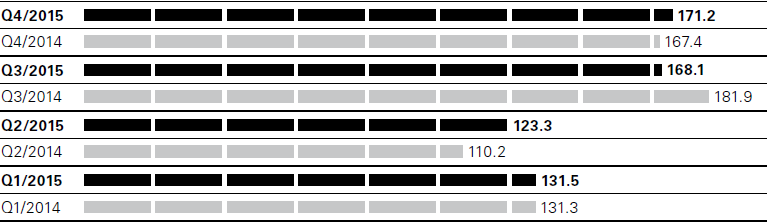
1% increase in EBITDA before special items
The key internal performance indicator EBITDA before special items increased year on year by 1% to EUR 594 million (2014: EUR 591 million). At 21.2%, the adjusted EBITDA margin was 180 basis points below the prior-year figure (2014: 23.0%). This development can mainly be attributed to the declining gross profit margin and the increase in operating expenses, with the latter exceeding sales growth. Due to an increase in the ratio of property, plant and equipment and intangible assets to total assets as a result of investments in the Group’s own retail business in particular, amortization and depreciation came to EUR 142 million, up 16% on the prior year (2014: EUR 123 million). Earnings before interest and taxes (EBIT) came to EUR 448 million as of the end of fiscal year 2015, down slightly on the prior year (2014: EUR 449 million).
Negative development of exchange rates exerting pressure on financial result
The financial result, measured as a net expense after aggregating the interest result and other financial items, increased in fiscal year 2015 to EUR 28 million (2014: EUR 12 million). This is primarily due to negative trends in the exchange rates of the Brazilian real and the Swiss franc. There were also one-time negative effects arising from the dissolution of derivatives used for hedging interest payments under the previous loan facility as well as interest expenses in connection with the tax field audit for the years 2007 to 2011 at HUGO BOSS AG. Notes to the Consolidated Financial Statements, Note 6
Group’s net income below prior-year level
At EUR 420 million, earnings before taxes were down 4% year on year (2014: EUR 437 million). At 24%, the Group’s income tax rate was slightly higher than in the prior year (2014: 23%). The shares of earnings of companies of the HUGO BOSS Group in Germany and abroad led to a slight increase in the Group’s tax rate in fiscal year 2015 due to regional differences in growth rates. The Group’s net income declined by 5% to EUR 319 million in the past fiscal year (EUR 2014: EUR 335 million). The net income attributable to equity holders of the parent company fell by 4% to EUR 319 million (2014: EUR 333 million). In the reporting period, net income attributable to non-controlling interests came to EUR 0 million (2014: EUR 1 million).
Earnings per share (in EUR)
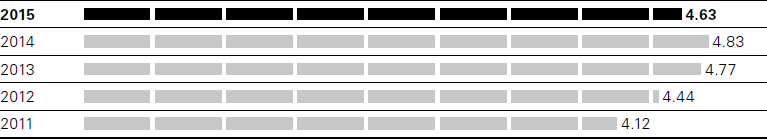
Earnings per share decreased by 4% to EUR 4.63 compared to the prior year (2014: EUR 4.83).